Table of Contents
Key Takeaways
- A leveraged buyout model helps a private equity firm plan an LBO transaction using debt financing and equity contribution.
- The model projects the target company’s cash flow to repay loans and estimates profit from the exit strategy.
- Sensitivity analysis tests how changes in growth or valuation multiples affect the transaction’s success.
- This leveraged buyout (LBO) model with example shows a $100 million acquisition yielding a 35 percent IRR after five years.
What Is an LBO Model?
A Leveraged Buyout (LBO) model is a financial tool used by buyers to evaluate the potential profit from purchasing a company primarily with borrowed funds.
Typically built in a spreadsheet, this model helps private equity firms assess whether they can acquire a business, repay loans with the company’s earnings, and sell it later at a higher value.
The model calculates key elements of the transaction:
- Purchase Funding: Buyers contribute a small portion of their own funds, usually 20 to 30 percent, and borrow the rest, often 70 to 80 percent, to cover the acquisition cost.
- Debt Repayment: The company’s annual earnings, known as cash flow, are used to pay back the loans over several years, typically five to ten.
- Profit Estimation: After reducing debt, buyers estimate the sale price to determine their profit, aiming for high returns on their initial funds.
This tool enables buyers to plan the acquisition, manage the company’s operations, and achieve financial success through careful analysis.
Understanding a Leveraged Buyout (LBO) Model with Example
A Leveraged Buyout (LBO) model helps buyers evaluate the financial success of acquiring a target company using mostly debt financing.
This section illustrates the model through an example, showing how a private equity firm structures an LBO transaction to achieve profit.
In this example:
- A private equity firm plans to acquire a company valued at $100 million.
- They contribute $35 million as their equity contribution and secure $70 million through debt financing, totaling $105 million to cover the acquisition cost and related expenses.
- The target company generates annual funds, known as Free Cash Flow (FCF), which are used to repay the $70 million in loans.
- After five years, the firm sells the company at an enterprise value of $163.5 million. The remaining debt is settled, and the firm retains the balance as profit.
This example shows how an LBO transaction uses a company’s cash flow to manage debt and create value for the buyer.
How a Leveraged Buyout Works
A Leveraged Buyout (LBO) follows a structured process to acquire and manage a target company, aiming for profit through an exit strategy.
This section shows the key steps, using the example of a $100 million acquisition to illustrate the buyout strategy.
- Identifying the Target Company: The private equity firm selects a business with consistent earnings, measured by EBITDA. In the example, the firm chooses a company with strong annual funds, suitable for supporting debt financing.
- Determining the Acquisition Price: The firm sets the purchase price, or enterprise value, at $100 million, based on the target company’s financial performance and market conditions.
- Arranging the Capital Structure: The firm uses $35 million as its equity contribution and secures $70 million in debt financing. This mix of funds enables the acquisition with minimal buyer capital.
- Operating the Company: After acquisition, the firm manages the company to generate Free Cash Flow (FCF). These funds primarily repay the debt, with operational improvements to enhance earnings.
- Executing the Exit Strategy: After five years, the firm sells the company at a higher enterprise value. The sale proceeds settle remaining debt, with the balance forming the firm’s profit.
This process relies on the company’s ability to produce funds, but excessive debt can risk failure if earnings fall short.
Steps to Build an LBO Model
A Leveraged Buyout (LBO) model requires careful planning to structure an LBO transaction and estimate returns.
An outline of the steps to build the model, using the example of a $100 million acquisition by a private equity firm, are explained below.
- Establish the Acquisition Cost: The firm determines the target company’s enterprise value using EBITDA. In the example, the company’s EBITDA is $20 million. Applying a valuation multiple of 5, the acquisition cost is $20 million times 5, equaling $100 million.
- Secure the Funding: The firm arranges the capital structure with $35 million as its equity contribution and $70 million in debt financing, totaling $105 million to cover the cost and expenses.
- Forecast Financial Performance: The firm estimates Free Cash Flow (FCF) to assess debt repayment capacity. This involves projecting revenue, EBITDA, and expenses to ensure sufficient funds.
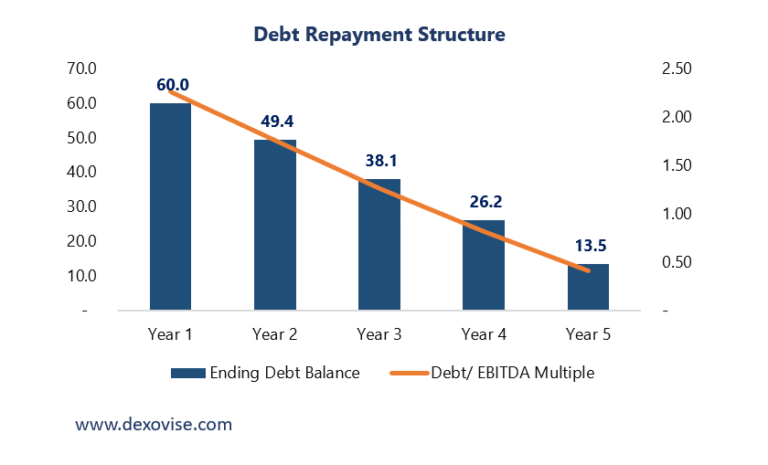
- Monitor Debt Repayment: The firm tracks loan repayments using the company’s FCF. In the example, the $70 million debt, comprising $50 million bank loan at 5 percent interest and $20 million bonds at 10 percent interest, is reduced annually.
Table 1 shows the repayment schedule, with annual payments of $14.5 million, lowering interest from $4.5 million in Year 1 to $1.8 million in Year 5, leaving $13.5 million by Year 5.
- Plan the Exit Strategy: The firm projects the sale price after five years. If EBITDA grows to $32.7 million and a 5 times valuation multiple applies, the enterprise value reaches $32.7 million times 5, or $163.5 million.
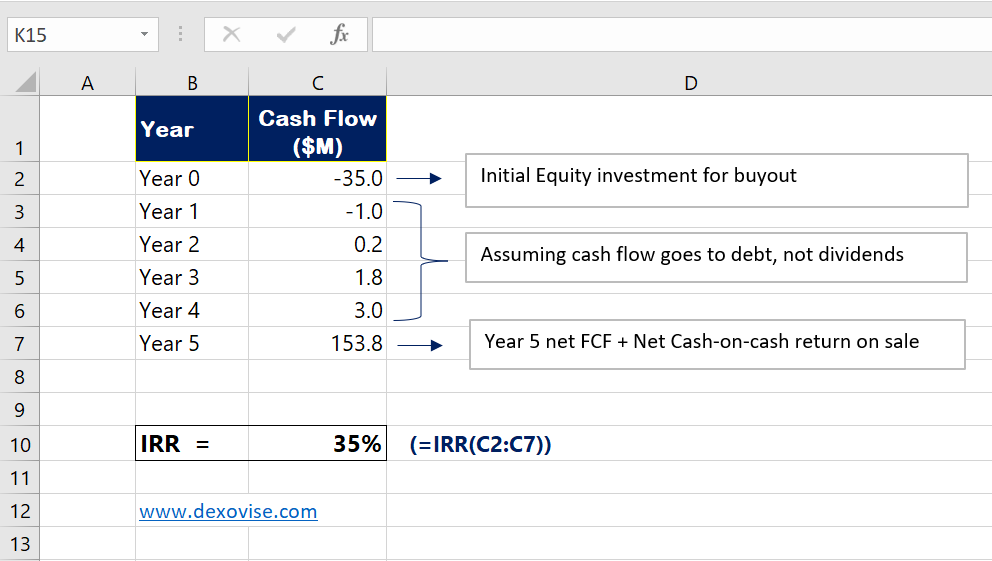
- Calculate Returns: The firm computes profit by subtracting the remaining debt ($13.5 million) and initial equity ($35 million) from the sale price ($163.5 million), yielding a cash profit of $115 million, or approximately 35% internal rate of return (IRR).
Table 1: Debt Repayment Table
| Year | Beginning Debt ($M) | Fixed Payment ($M) | Interest ($M) | Principal Paid ($M) | Ending Debt ($M) |
| 1 | 70.0 | 14.5 | 4.5 | 10.0 | 60.0 |
| 2 | 60.0 | 14.5 | 3.9 | 10.6 | 49.4 |
| 3 | 49.4 | 14.5 | 3.2 | 11.3 | 38.1 |
| 4 | 38.1 | 14.5 | 2.6 | 11.9 | 26.2 |
| 5 | 26.2 | 14.5 | 1.8 | 12.7 | 13.5 |
The $70M debt is structured as $50 million bank loan at 5% and $20 million bonds at 10%. The annual repayments are assumed at $14.5M.
The annual interest drops from $4.5million in Year 1 to $1.8 million in year 5 as the debt shrinks. This shows how the company’s EBITDA handle the loans over time.
Sources and Uses of Funds Table
A Leveraged Buyout (LBO) model begins with a clear outline of how funds are obtained and allocated for the acquisition.
The sources and uses of funds table details the capital structure, showing the private equity firm’s financing plan.
This section presents the table based on the $100 million LBO transaction example.
Table 2: Source and Use of Funds
| Sources | Amount ($M) | Uses | Amount ($M) |
| Equity (Buyer’s Cash) | 35 | Purchase Price | 100 |
| Bank Loan | 50 | Fees (Legal, etc.) | 5 |
| Bonds | 20 | ||
| Total Sources | 105 | Total Uses | 105 |
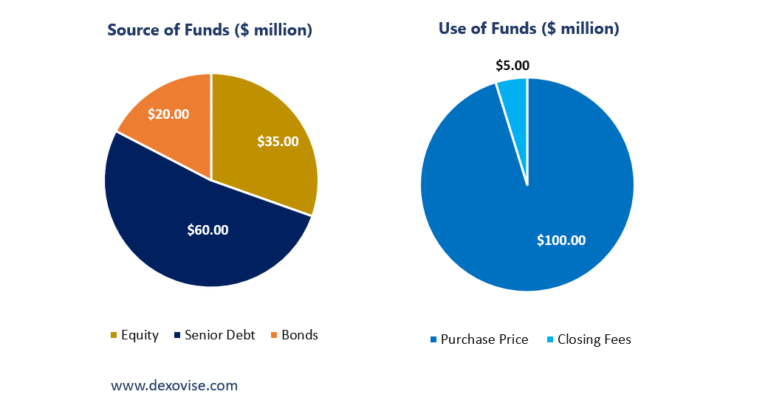
- Sources: The firm provides $35 million as its equity contribution, representing 33 percent of the total funds.
Debt financing, comprising $70 million from loans, covers the remaining 67 percent.
- Uses: The acquisition cost of the target company is $100 million, with an additional $5 million allocated to transaction expenses, such as legal and advisory fees.
This table ensures the LBO transaction balances funding sources with their intended uses, supporting the buyout strategy.
Types of Debt in an LBO
Debt financing forms the foundation of a Leveraged Buyout (LBO), enabling the private equity firm to acquire a target company with minimal equity contribution. Various debt types support the capital structure, each with distinct terms.
This section describes the debt options, using the $100 million LBO transaction example.
- Senior Debt (Bank Loans): These loans, often from banks, carry lower interest rates due to their priority in repayment.
In the example, $50 million of the $70 million debt financing is senior debt at 5 percent interest, requiring $2.5 million annually.
- Subordinated Debt (Mezzanine): This debt involves higher interest rates due to increased risk, as it is repaid after senior debt.
The example does not use mezzanine debt, prioritizing other options for cost efficiency.
- Revolving Credit Line: This provides flexible funds for short-term needs, such as operational expenses. Typically, $5 to $10 million, it incurs interest only when used and is not utilized in the example.
- High-Yield Bonds: Issued to investors, these bonds carry higher interest rates, such as 10 percent. In the example, $20 million of debt financing comes from bonds, requiring $2 million annually.
The firm selects a mix of debt to balance costs and repayment capacity, ensuring the LBO’s financial stability.
Key Assumptions in an LBO Model
A Leveraged Buyout (LBO) model relies on assumptions to project the financial outcome of an LBO transaction. These estimates guide the private equity firm’s buyout strategy, shaping the acquisition and exit plan.
This section lists the main assumptions, using the $100 million acquisition example.
- Purchase Price Multiple: The firm sets the target company’s enterprise value using EBITDA. In the example, the company’s EBITDA is $20 million. A valuation multiple of 5 times results in a purchase price of $20 million times 5, or $100 million.
- Debt-to-Equity Split: The firm funds the acquisition with $35 million as its equity contribution and $70 million in debt financing. This balance supports the purchase with limited buyer funds.
- Interest Rates: The firm assumes rates for the $70 million debt: $50 million from bank loans at 5 percent costs $2.5 million yearly, and $20 million from bonds at 10 percent costs $2 million, totaling $4.5 million in Year 1.
- Revenue Growth Rate: The firm expects the company’s sales to grow by 5 percent each year. Starting at $100 million, sales reach $105 million in Year 1 and increase annually.
- Exit Multiple and Timing: The firm plans to sell after five years, assuming a 5 times EBITDA multiple. With EBITDA at $32.7 million by Year 5, the enterprise value becomes $32.7 million times 5, or $163.5 million.
These assumptions form the basis of the model, allowing the firm to test the transaction’s potential success.
Building Financial Projections
Financial projections form a critical part of a Leveraged Buyout (LBO) model, estimating the target company’s performance after acquisition. These forecasts guide the private equity firm in managing debt repayment and planning the exit strategy.
This section outlines the steps to create projections, using the $100 million LBO transaction example over five years.
- Estimate Revenue: The company’s sales start at $100 million in Year 0. Assuming a 5 percent growth rate, sales increase to $105 million in Year 1, $110.3 million in Year 2, and continue growing annually.
- Calculate EBITDA: EBITDA reflects earnings before interest, taxes, depreciation, and amortization. With a 21.4 percent margin in Year 1, $105 million in sales yields $22.5 million in EBITDA, rising with revenue each year.
- Deduct Interest: The $70 million debt includes $50 million in bank loans at 5 percent and $20 million in bonds at 10 percent. Interest starts at $4.5 million in Year 1 and decreases as debt is repaid. Table 3 details the costs.
- Account for Taxes and Capital Expenses: Taxes apply at 25 percent on profits after interest. Capital expenses, such as equipment, begin at $3 million in Year 1 and grow slightly each year.
- Determine Free Cash Flow: Free Cash Flow (FCF) is EBITDA minus interest, taxes, and capital expenses. This fund repays the $70 million debt annually. Table 4 shows FCF over five years.
Table 3: Interest Costs Table
| Year | Beginning Debt ($M) | Bank Loan ($M) | Bonds ($M) | Interest (5% Bank) ($M) | Interest (10% Bonds) ($M) | Total Interest ($M) |
| 1 | 70.0 | 50.0 | 20.0 | 2.5 | 2.0 | 4.5 |
| 2 | 60.0 | 42.1 | 17.9 | 2.1 | 1.8 | 3.9 |
| 3 | 49.4 | 33.9 | 15.5 | 1.7 | 1.6 | 3.2 |
| 4 | 38.1 | 25.2 | 12.9 | 1.3 | 1.3 | 2.6 |
| 5 | 26.2 | 16.1 | 10.1 | 0.8 | 1.0 | 1.8 |
Table 4: Annual Free Cash Flow Table
| Year | Revenue ($M) | EBITDA ($M) | Interest ($M) | EBT ($M) | Taxes (25%) ($M) | CapEx ($M) | FCF Before Debt ($M) | Debt Payment ($M) | FCF After Debt ($M) |
| 1 | 105 | 26.5 | 4.5 | 22.0 | 5.5 | 3.0 | 13.5 | 14.5 | -1.0 |
| 2 | 110.3 | 28.1 | 3.8 | 24.3 | 6.1 | 3.5 | 14.7 | 14.5 | 0.2 |
| 3 | 115.8 | 30.2 | 3.2 | 27.0 | 6.8 | 4.0 | 16.3 | 14.5 | 1.8 |
| 4 | 121.6 | 31.8 | 2.5 | 29.3 | 7.3 | 4.5 | 17.5 | 14.5 | 3.0 |
| 5 | 127.6 | 32.7 | 1.6 | 31.1 | 7.8 | 5.0 | 18.3 | 14.5 | 3.8 |
These projections indicates the capability of the company to generate funds for debt repayment, supporting the LBO’s success.
Calculating Returns in an LBO
Calculating returns in a Leveraged Buyout (LBO) model measures the private equity firm’s profit from the LBO transaction. This process evaluates the financial success of acquiring and selling the target company.
This section explains the steps to compute returns, using the $100 million acquisition example.
- Determine the Exit Value: After five years, the company’s EBITDA reaches $32.7 million. Applying a valuation multiple of 5, the enterprise value is $32.7 million times 5, or $163.5 million.
- Subtract Remaining Debt: The original $70 million debt is reduced by $56.5 million through annual Free Cash Flow payments, leaving $13.5 million. The equity value is $163.5 million minus $13.5 million, equaling $150 million.
- Compute Cash-on-Cash Return: The firm’s equity contribution was $35 million. With $150 million equity value, the return is $150 million divided by $35 million, or 4.29 times the initial funds.
Cash-on-Cash Return = Exit Equity Value ÷ Initial Equity
= $150 million ÷ $35 million = 4.29x
- Calculate Internal Rate of Return (IRR): The IRR reflects the annual growth rate. Using cash flows, $35 million outflow in Year 0, annual Free Cash Flow, and $150 million inflow in Year 5, the IRR is approximately 35 percent.
- Evaluate the Target: The firm aims for an IRR of 20 to 35 percent. At 35 percent, the LBO transaction meets expectations, assuming projections hold.
These steps confirm the buyout strategy’s potential to generate strong returns.
LBO Sensitivity
Sensitivity analysis in a Leveraged Buyout (LBO) model tests how changes in assumptions affect the financial outcome of the LBO transaction.
This process helps the private equity firm assess risks in the buyout strategy.
This section explains sensitivity analysis, using the $100 million acquisition example.
- Purpose of Analysis: The analysis evaluates the Internal Rate of Return (IRR) if key factors, such as revenue growth or exit valuation multiple, differ from projections. It ensures the transaction remains viable under varying conditions.
- Method of Analysis: The firm creates a table comparing two variables, such as revenue growth and exit multiple, to calculate IRR for each scenario. Table 5 shows the results for the example.
- Interpretation of Results: In the base case, a 5 percent growth rate and 5 times exit multiple yield a 35 percent IRR. If growth drops to 3 percent and the multiple to 4, IRR falls to 25 percent, still acceptable.
Higher values, like 7 percent growth and 7 times multiple, raise IRR to 47 percent.
Table 5: Exit Multiple/ Revenue Growth Table
| Exit Multiple / Growth | 3% Growth | 5% Growth | 7% Growth |
| 4x | 25% | 28% | 31% |
| 5x | 31% | 35% | 39% |
| 6x | 37% | 42% | 47% |
Conclusion
A Leveraged Buyout (LBO) model provides a structured approach for a private equity firm to acquire a target company using debt financing and achieve profit through an exit strategy.
Using the $100 million LBO transaction example, this guide explains the process: setting an acquisition cost with a valuation multiple, arranging a capital structure with $35 million equity contribution and $70 million debt. The model projected cash flow to repay loans, and sell the company for $163.5 million after five years.
The LBO transaction yielded a 35% Internal Rate of Return. Sensitivity analysis highlights risks by testing changes in growth or multiples.
The model supports financial sponsors in evaluating buyout strategies, ensuring informed decisions for acquisitions and portfolio company management.